Monthly Archives: July 2024

Damage Assessment – Hurricane Sandy

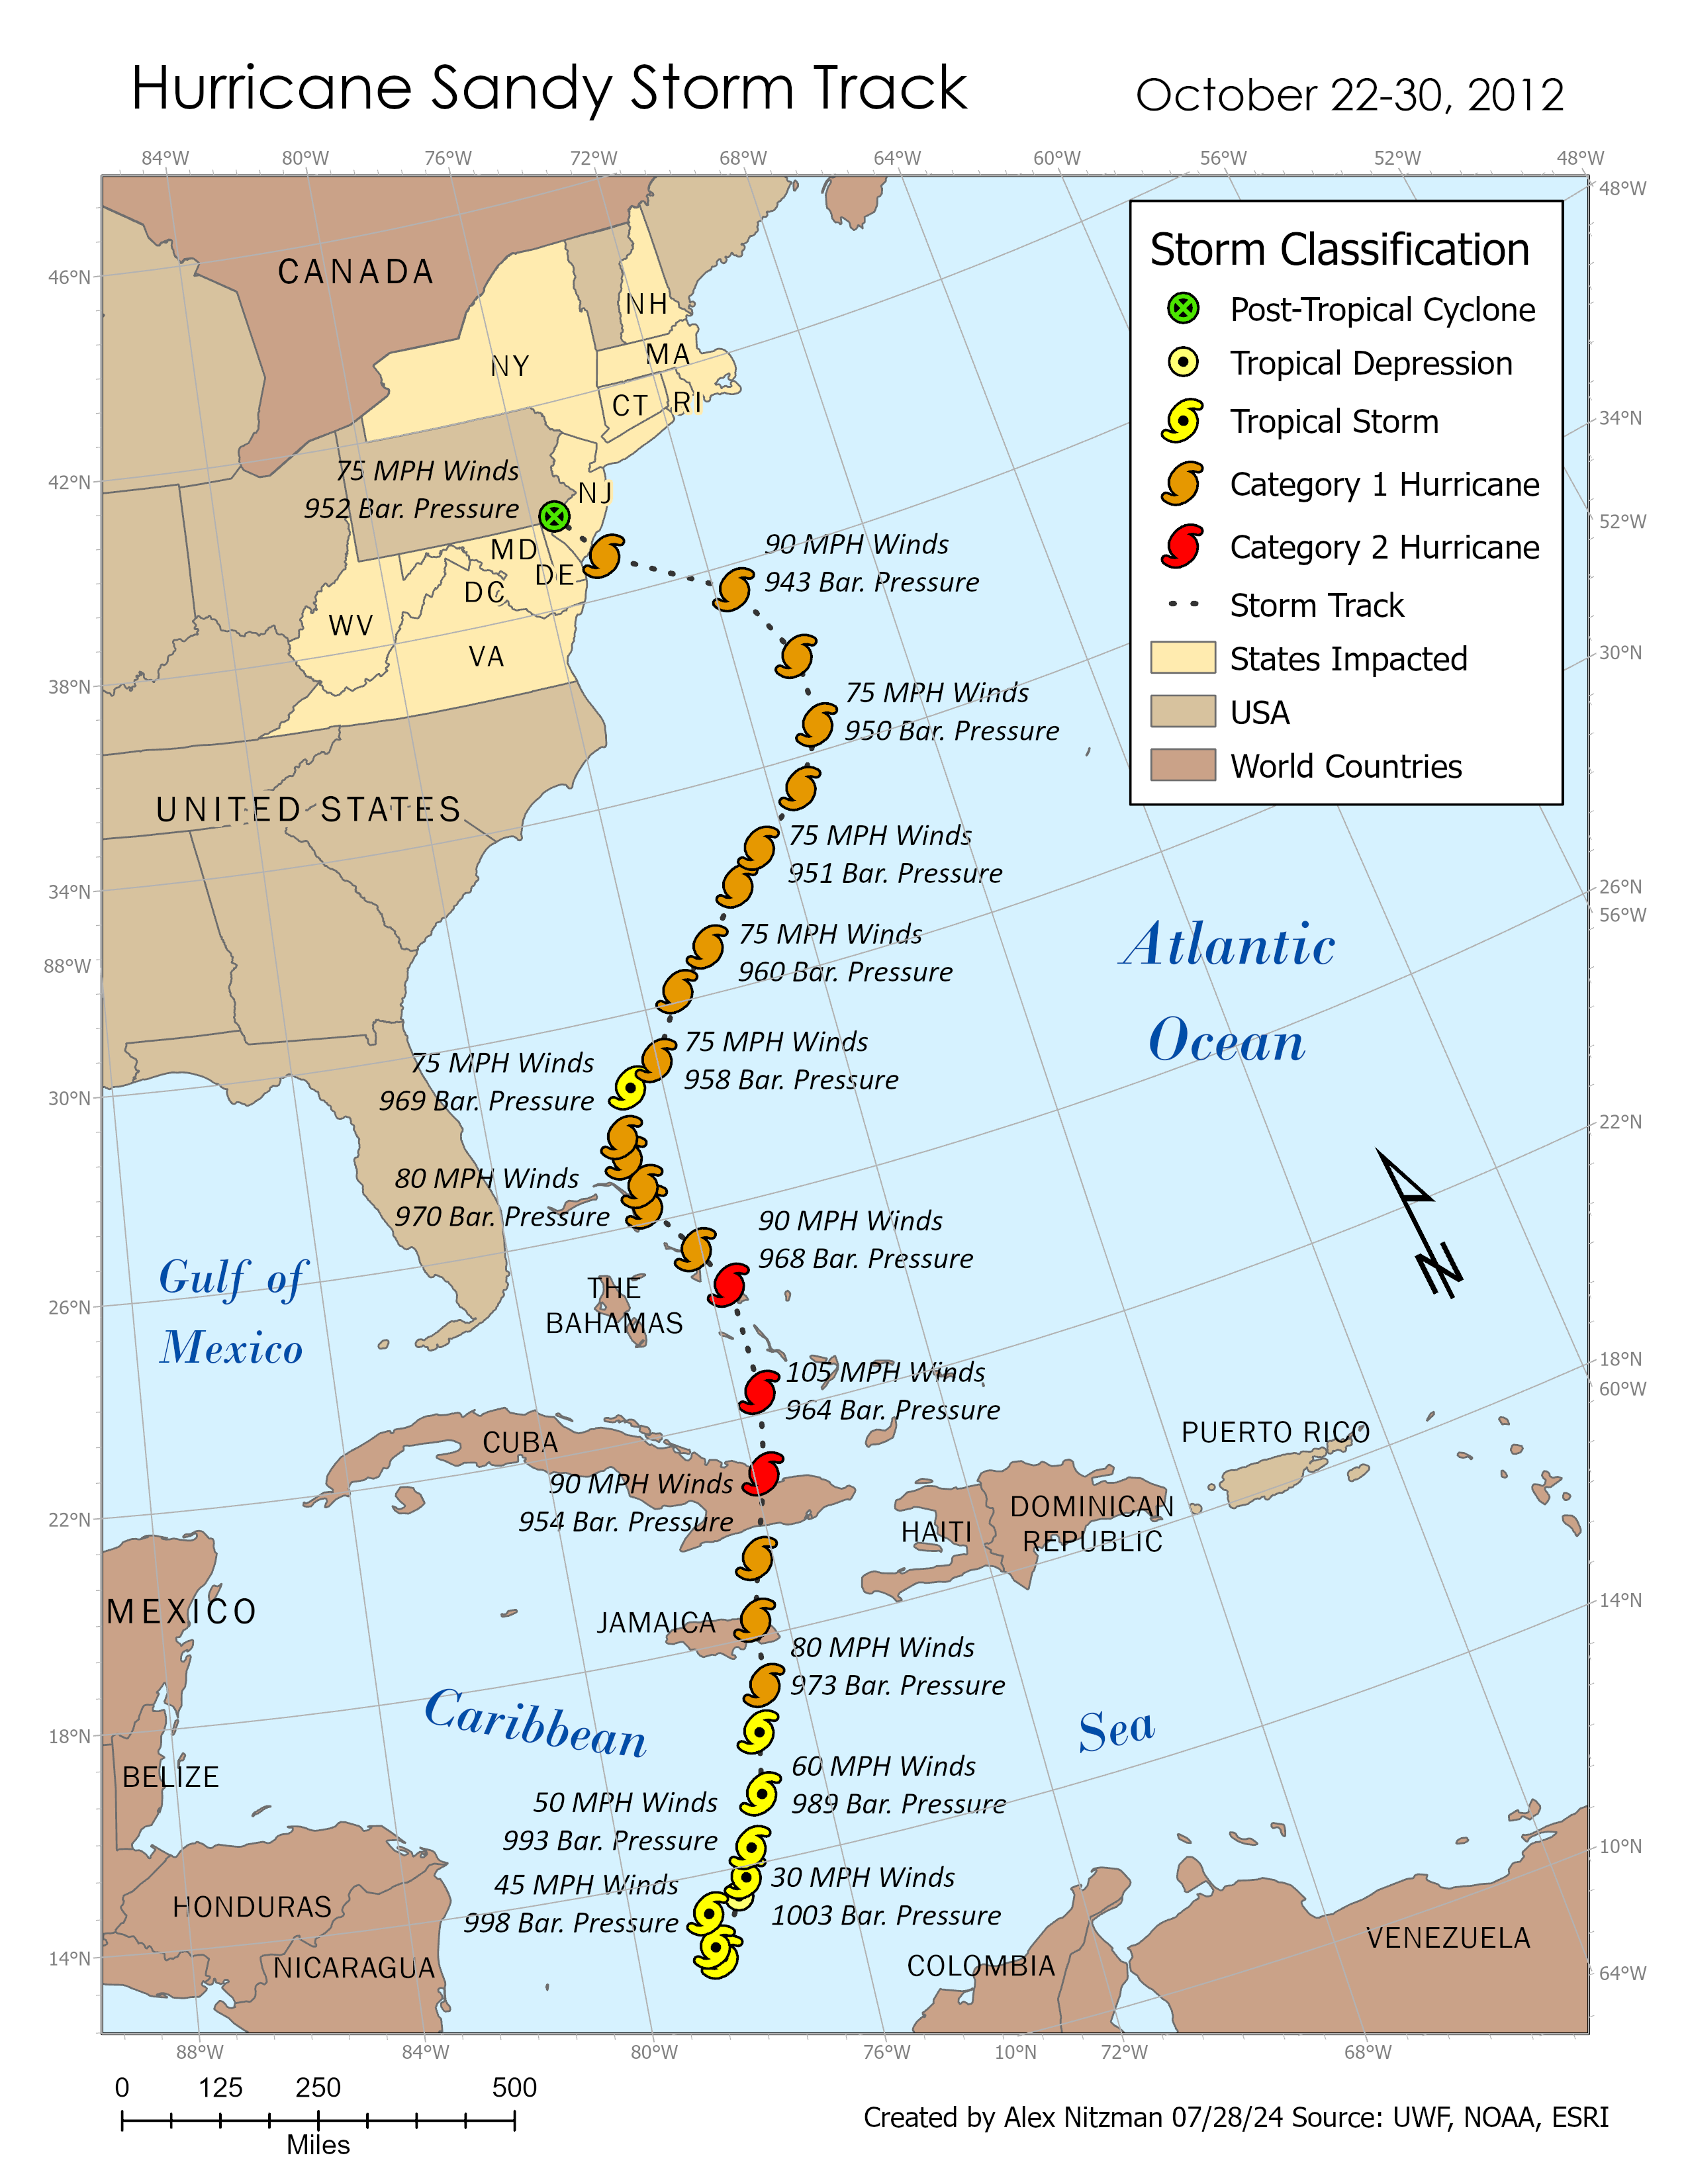
Module 5 for GIS Applications continues our focus on Hurricane Sandy and explores damage assessment for the storm's impact in the Garden State. Our first task was to create a formal hurricane track map showing the path Sandy took from the Caribbean Sea to the Northeastern U.S. The symbology uses custom color coded coordinate points showing the hierarchy of storm intensity. Included are the maximum sustained winds and the [...]

By |2024-11-11T12:14:37-05:00July 30th, 2024|GIS|Comments Off on Damage Assessment – Hurricane Sandy

Coastal Flooding Analysis – Storm Surge

Module 4 for GIS Applications performs analyses on coastal flooding and storm surge. Storm surge is generally associated with landfalling tropical storms and hurricanes, but it can also be attributed to extratropical storms, such a Nor'easters along the Eastern Seaboard, or powerful winter storms with low barometric pressure and tight wind gradients. Coastal flooding events can also be due to spring tide events based upon the moon's cycle. The [...]

By |2024-11-11T12:03:51-05:00July 24th, 2024|GIS|Comments Off on Coastal Flooding Analysis – Storm Surge

Visualizing data in 3D with GIS

The course work for GIS Applications Module 3 looks further into 3D visualization, Line of Sight (LOS) analysis and Viewshed analysis with ArcGIS Pro. We are tasked with completing four exercises through ESRI training and read an article accessing the Lines of Torres Vedra, the defensive lines constructed to defend the Portuguese capital of Lisbon against Napoleon in 1810, with LOS analysis in GIS. Presentation of GIS data in [...]

By |2024-11-11T11:45:34-05:00July 17th, 2024|GIS|Comments Off on Visualizing data in 3D with GIS

GIS applications using LiDAR

Module 2 for GIS Applications returns us to take a more in depth look at the use of LiDAR, a topic briefly covered in previous courses. LiDAR (LIght Detection And Ranging) uses lasers, usually in the visible or near-infrared portion of the spectrum, calculates heights by measuring distances between a scanner and target area. The high energy pulses record the reflected response of different objects in a very narrow [...]

By |2024-11-11T10:55:56-05:00July 8th, 2024|GIS|Comments Off on GIS applications using LiDAR

Crime Analysis in GIS

Our first topic in GIS Applications is crime analysis and the use of crime mapping for determining crime hotspots. Crime mapping techniques provide insight into the spatial and temporal distributions of crime. This benefits criminologists in the research community and professionals in law enforcement. Crime mapping factors in the importance of local geography as a reason for crime and considers that it may be as important as criminal motivation. [...]

By |2024-11-11T10:45:59-05:00July 3rd, 2024|GIS|Comments Off on Crime Analysis in GIS
Go to Top