
Module 4 for GIS Applications performs analyses on coastal flooding and storm surge. Storm surge is generally associated with landfalling tropical storms and hurricanes, but it can also be attributed to extratropical storms, such a Nor’easters along the Eastern Seaboard, or powerful winter storms with low barometric pressure and tight wind gradients. Coastal flooding events can also be due to spring tide events based upon the moon’s cycle.

Storm surge inundating Bayshore Boulevard in Tampa during Hurricane Idalia on August 30, 2023.
The first lab assignment revisits Superstorm Sandy, which made landfall as a hurricane transitioning into a powerful extratropical storm along the New Jersey coastline on October 29, 2012. The second and third part of the lab assignment uses Digital Elevation Models (DEMs) to develop scenarios for a generalized storm surge.
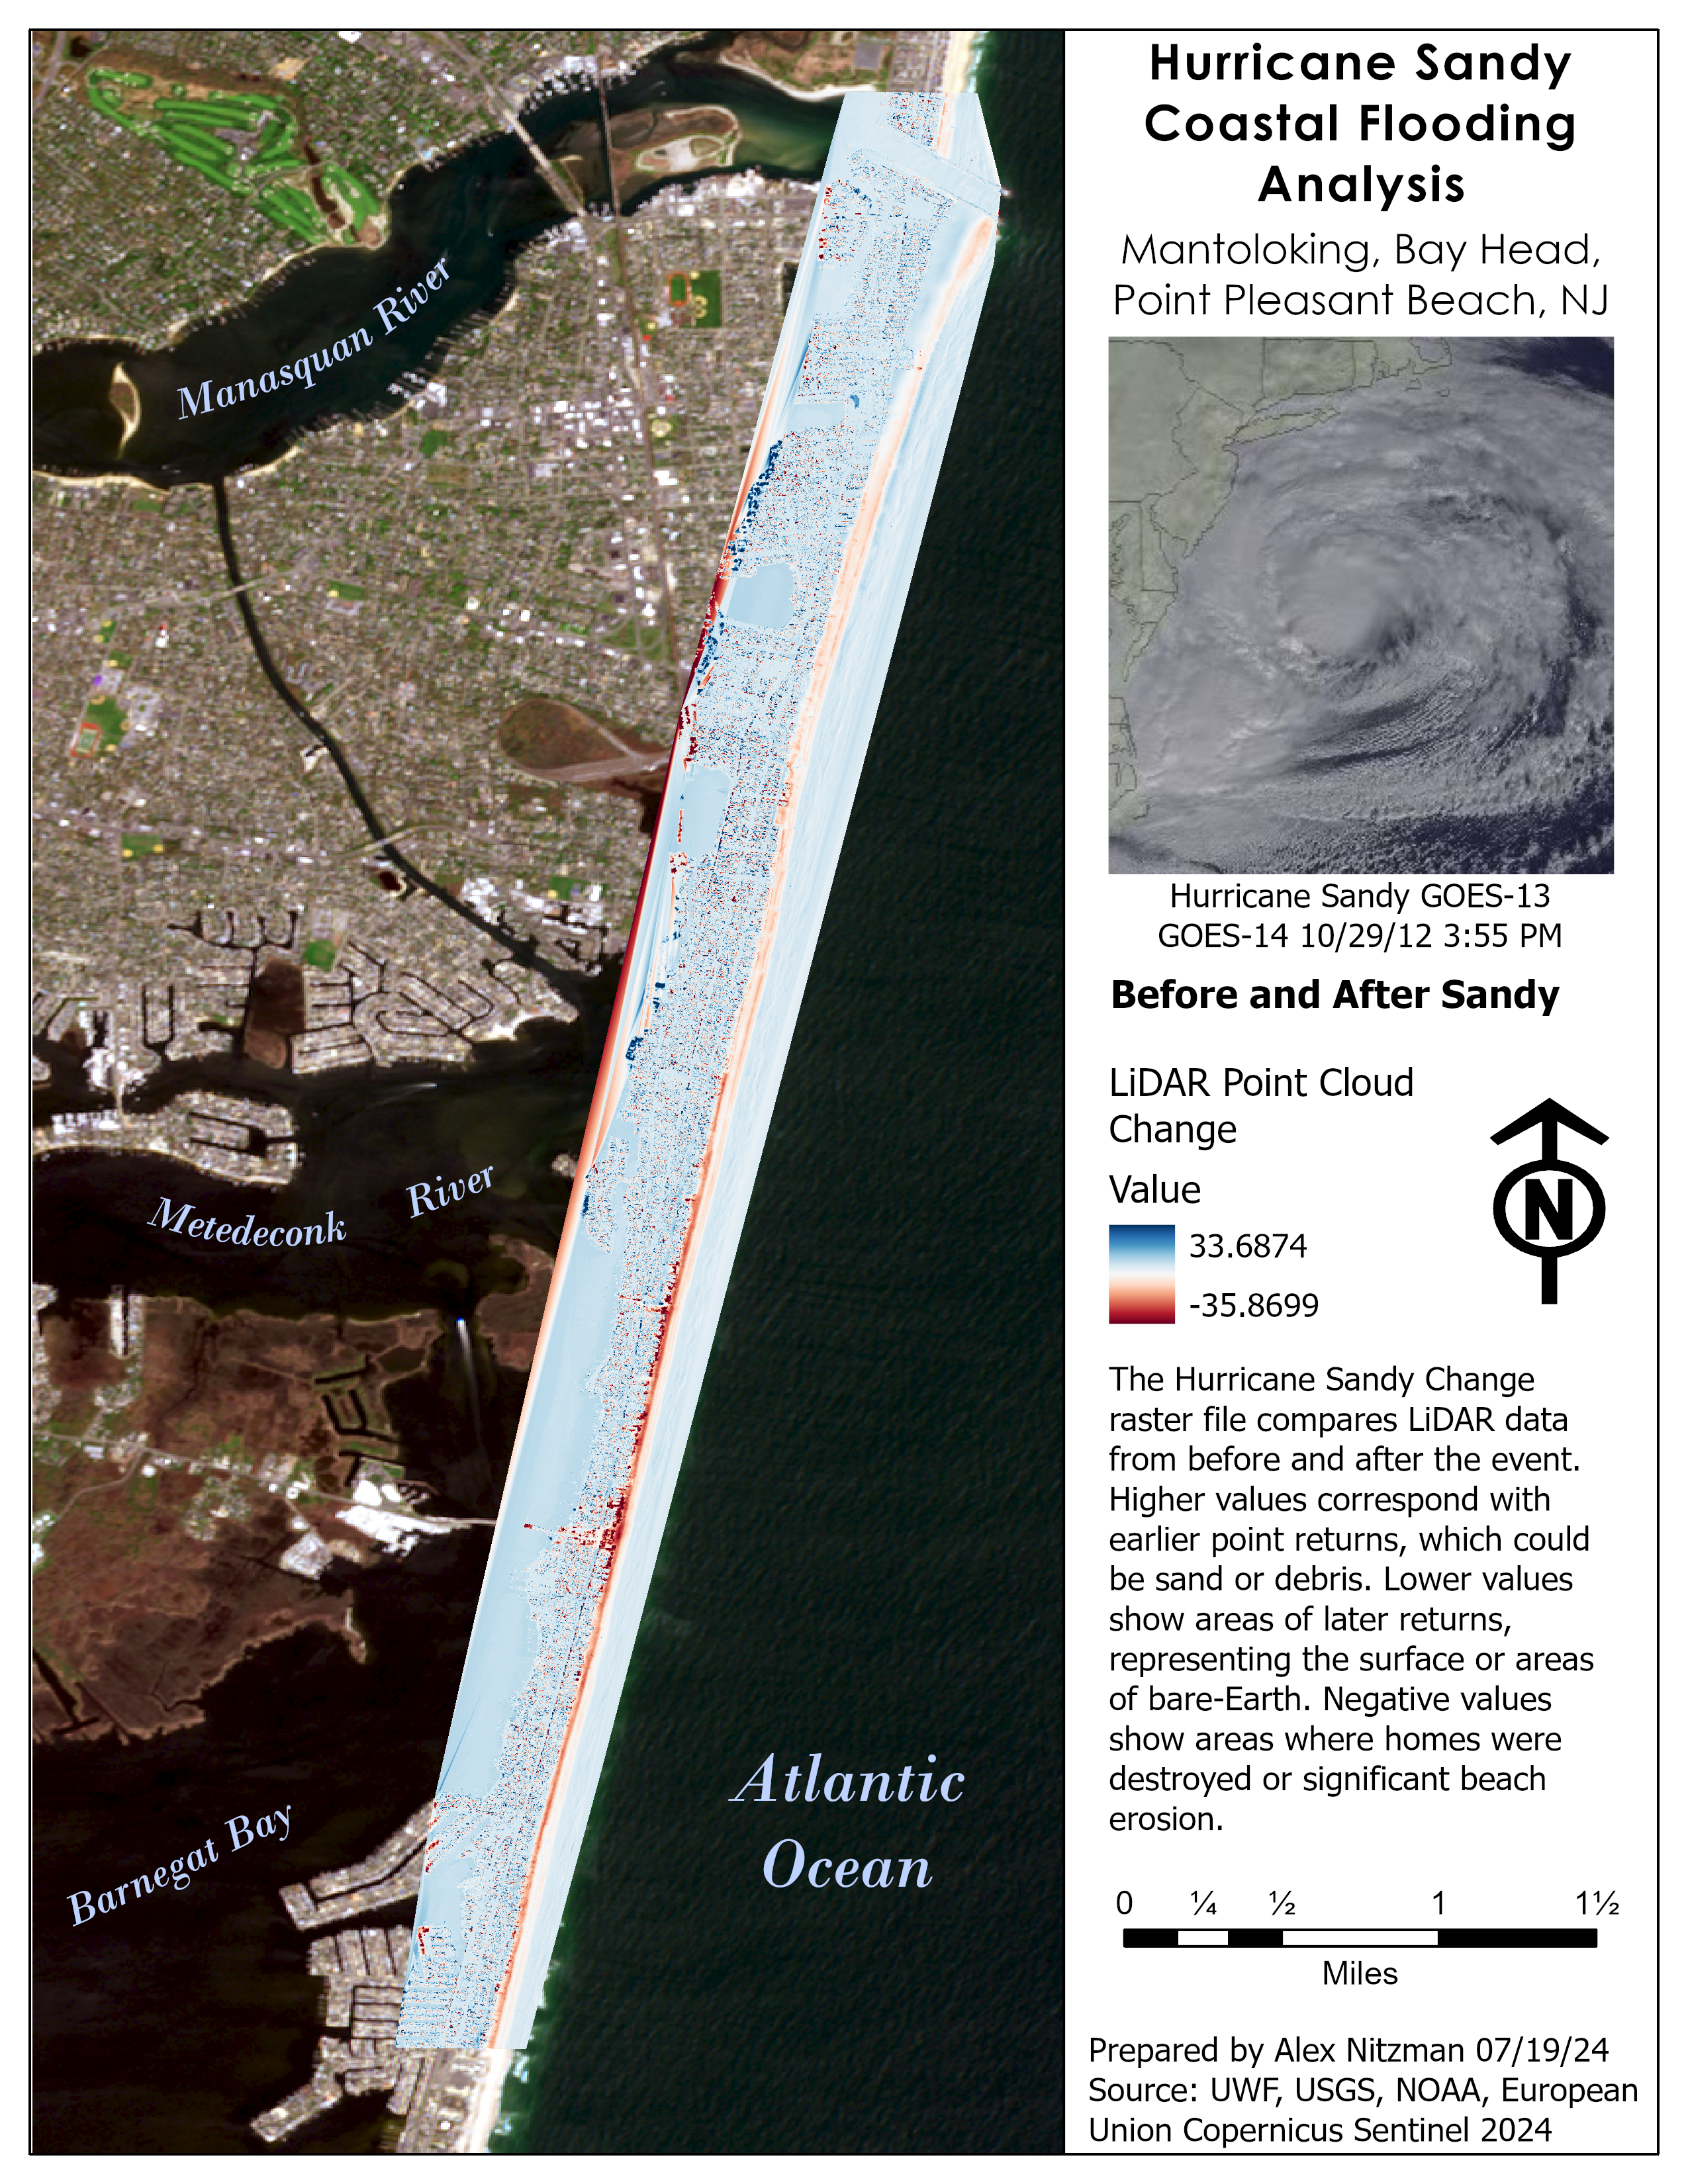
The lab analysis on Hurricane Sandy works with LiDAR data covering a barrier island along the Atlantic Ocean between Mantoloking and Point Pleasant Beach, New Jersey. LAS files were downloaded showing the conditions before the storm’s impact and afterward.
Initial work in the lab for Module 4 created DEMs by converting the two LAS files to TIN files using geoprocessing in ArcGIS Pro. The TINs were then converted to a raster with a separate geoprocessing tool running upwards of ten minutes.
Comparing the two raster datasets, some pronounced impacts from the hurricane turned extratropical storm were visible. Several datapoints representing structures along the beach were noticeably missing. Additionally a wide breech was cut across the island, with several smaller breeches visible further north. It also appearing that severe scouring of the sand along the coast occurred with a wide area of lower data returns on the post Sandy dataset.
Indicative of the large file size of LiDAR data, when substracting the raster cell values of the post Sandy dataset from the pre Sandy dataset, geoprocessing took 12 minutes and 59 seconds. The result is a raster with values ranging from 33.69 to -35.87. Values toward the high range reflect earlier LiDAR returns, representing the build-up of material, such as sand or debris. Lower values in the change raster indicate later returns, or returns of bare-Earth. This correlates to areas where significant erosion may have occurred or the destruction of a structure.
The change in the the LiDAR pointclouds reveal parcels where homes were destroyed or where the barrier island was breeched by storm surge. The change raster quantifies the amount of change.
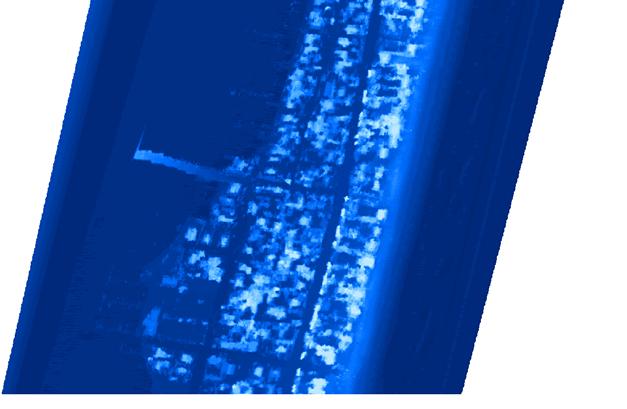
LiDAR before Superstorm Sandy
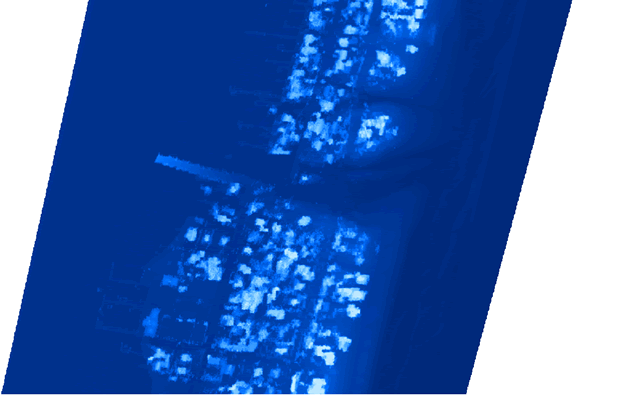
LiDAR showing a major breech caused by Superstorm Sandy
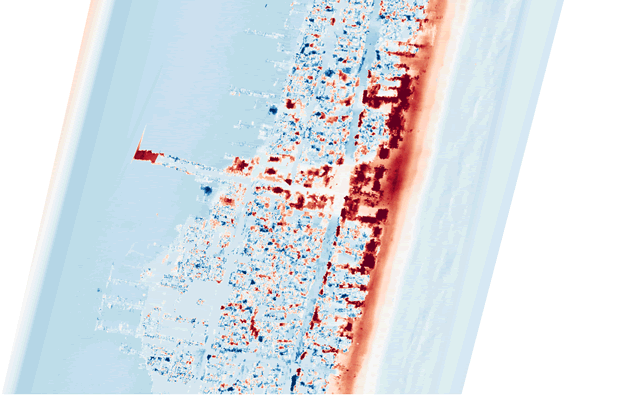
The difference between the two LiDAR pointclouds showing the breech and associated destruction of structures
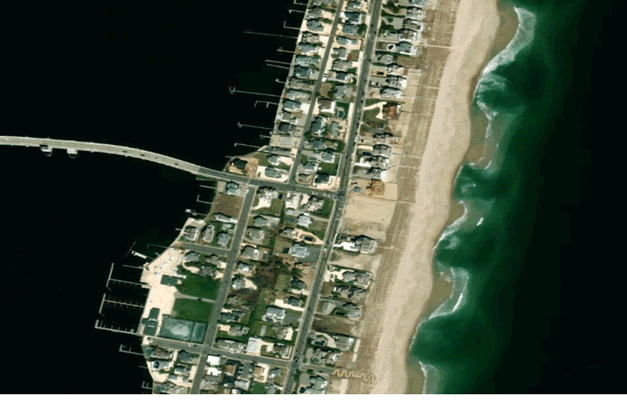
Recent aerial imagery of Mantoloking, NJ where the breech occurred
The overall impact of Hurricane Sandy on the boroughs of Mantoloking, Bay Head and Point Pleasant Beach in Ocean County, New Jersey:
The second analysis for Module 4 utilizes a storm surge DEM for the state of New Jersey. Our task was to reclassify the raster where all cells with values of 2 meters or less constitute areas potentially submerged as a result of Hurricane Sandy. Those cells with values above 2 meters were classified as “no data.”
I began the process by adding a new field to the DEM for flooded areas due to storm surge. Cells where the elevation value was equal to or less than 2 were assigning a flood value of 1 for the Boolean of true. All other cells with an elevation value above 2 were assigned 0, for false.
With the added field, I used the Reclassify geoprocessing tool to output a raster of the DEM showing potentially flooded areas versus those at higher ground. The mask was set to the feature class of the New Jersey state outline to exclude areas of the DEM outside of the state that were not needed for our analysis.
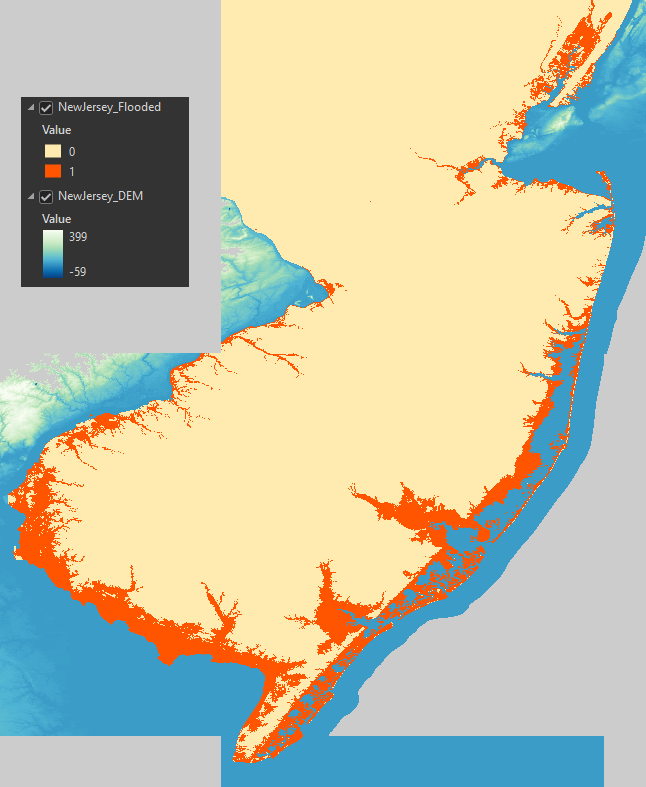
Output raster using a Boolean
Our analysis then focused on Cape May County in South Jersey, where we quantify the percentage of the county potentially inundated with a 2 meter storm surge. The storm surge raster was converted to a polygon and subsequently clipped to the the polygon of the Cape May County boundary.
Another issue encountered was that the storm surge data and county boundary were in different units of measurement. Ended up clipping the storm surge polygon from the county polygon, then comparing the output with the unclipped county boundary for the final percentage. This workaround succeeded as both used the same units.
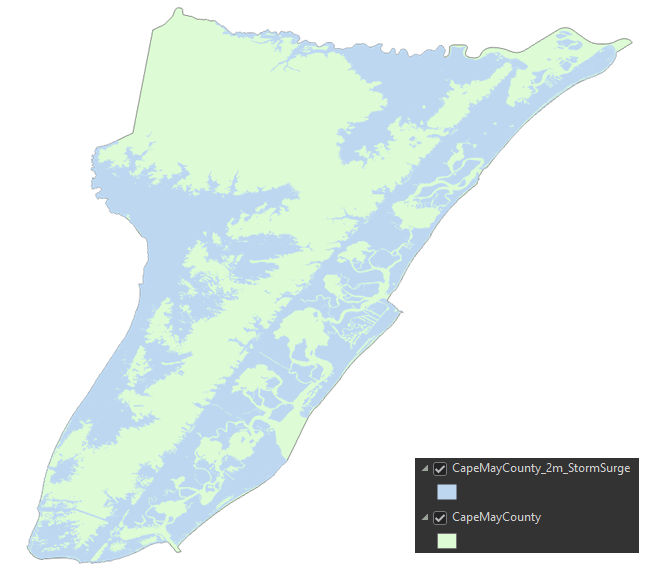
2-ft storm surge data clipped to Cape May County, NJ

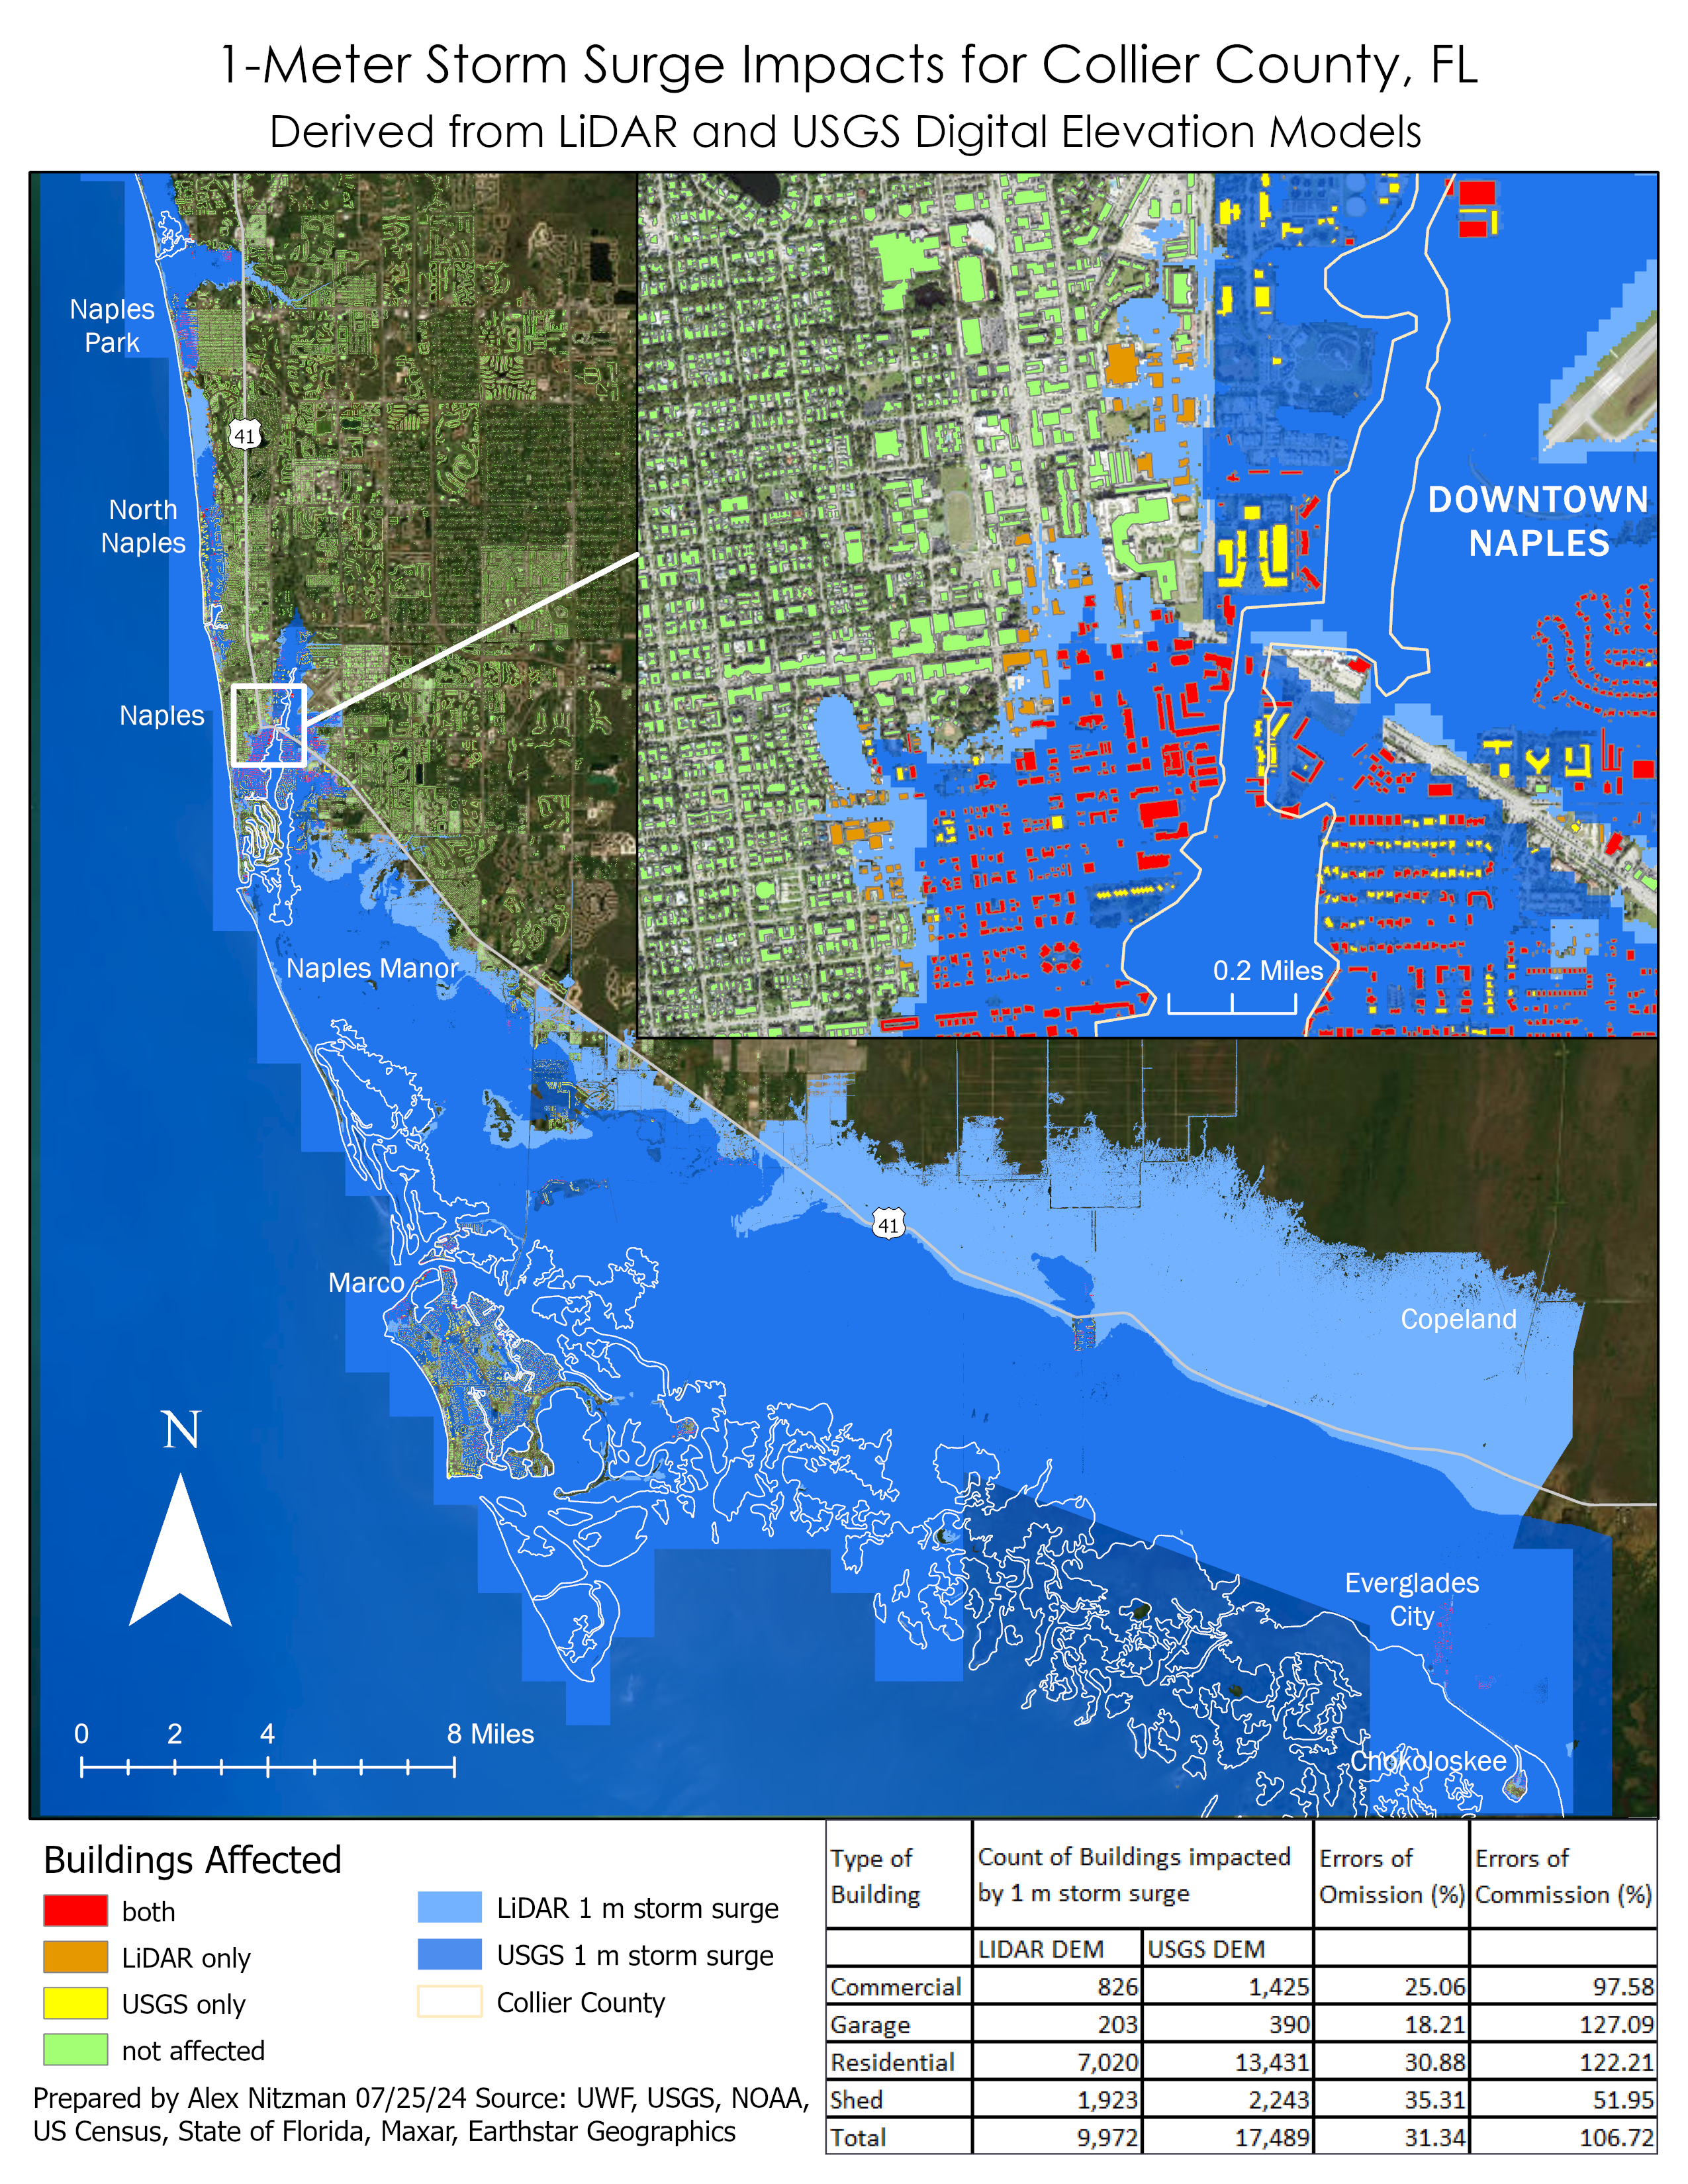
Region Group assigns a unique ObjectID for each homogenous area of raster cells. The different colors in this sample from Naples shows separate groups for each land and hydrologic feature based upon the 1 meter elevation threshold
Using the Extract by Attribute geoprocessing tool, selecting the hydrologic area comprising the entire tidal basin is straightforward once the ObjectID number is determined. With that, a new raster comprising just water areas subjected to storm surge is output and subsequently converted to a polygon. The polygon feature class was juxtaposed with a feature class of building footprints for quantitative analysis.


