
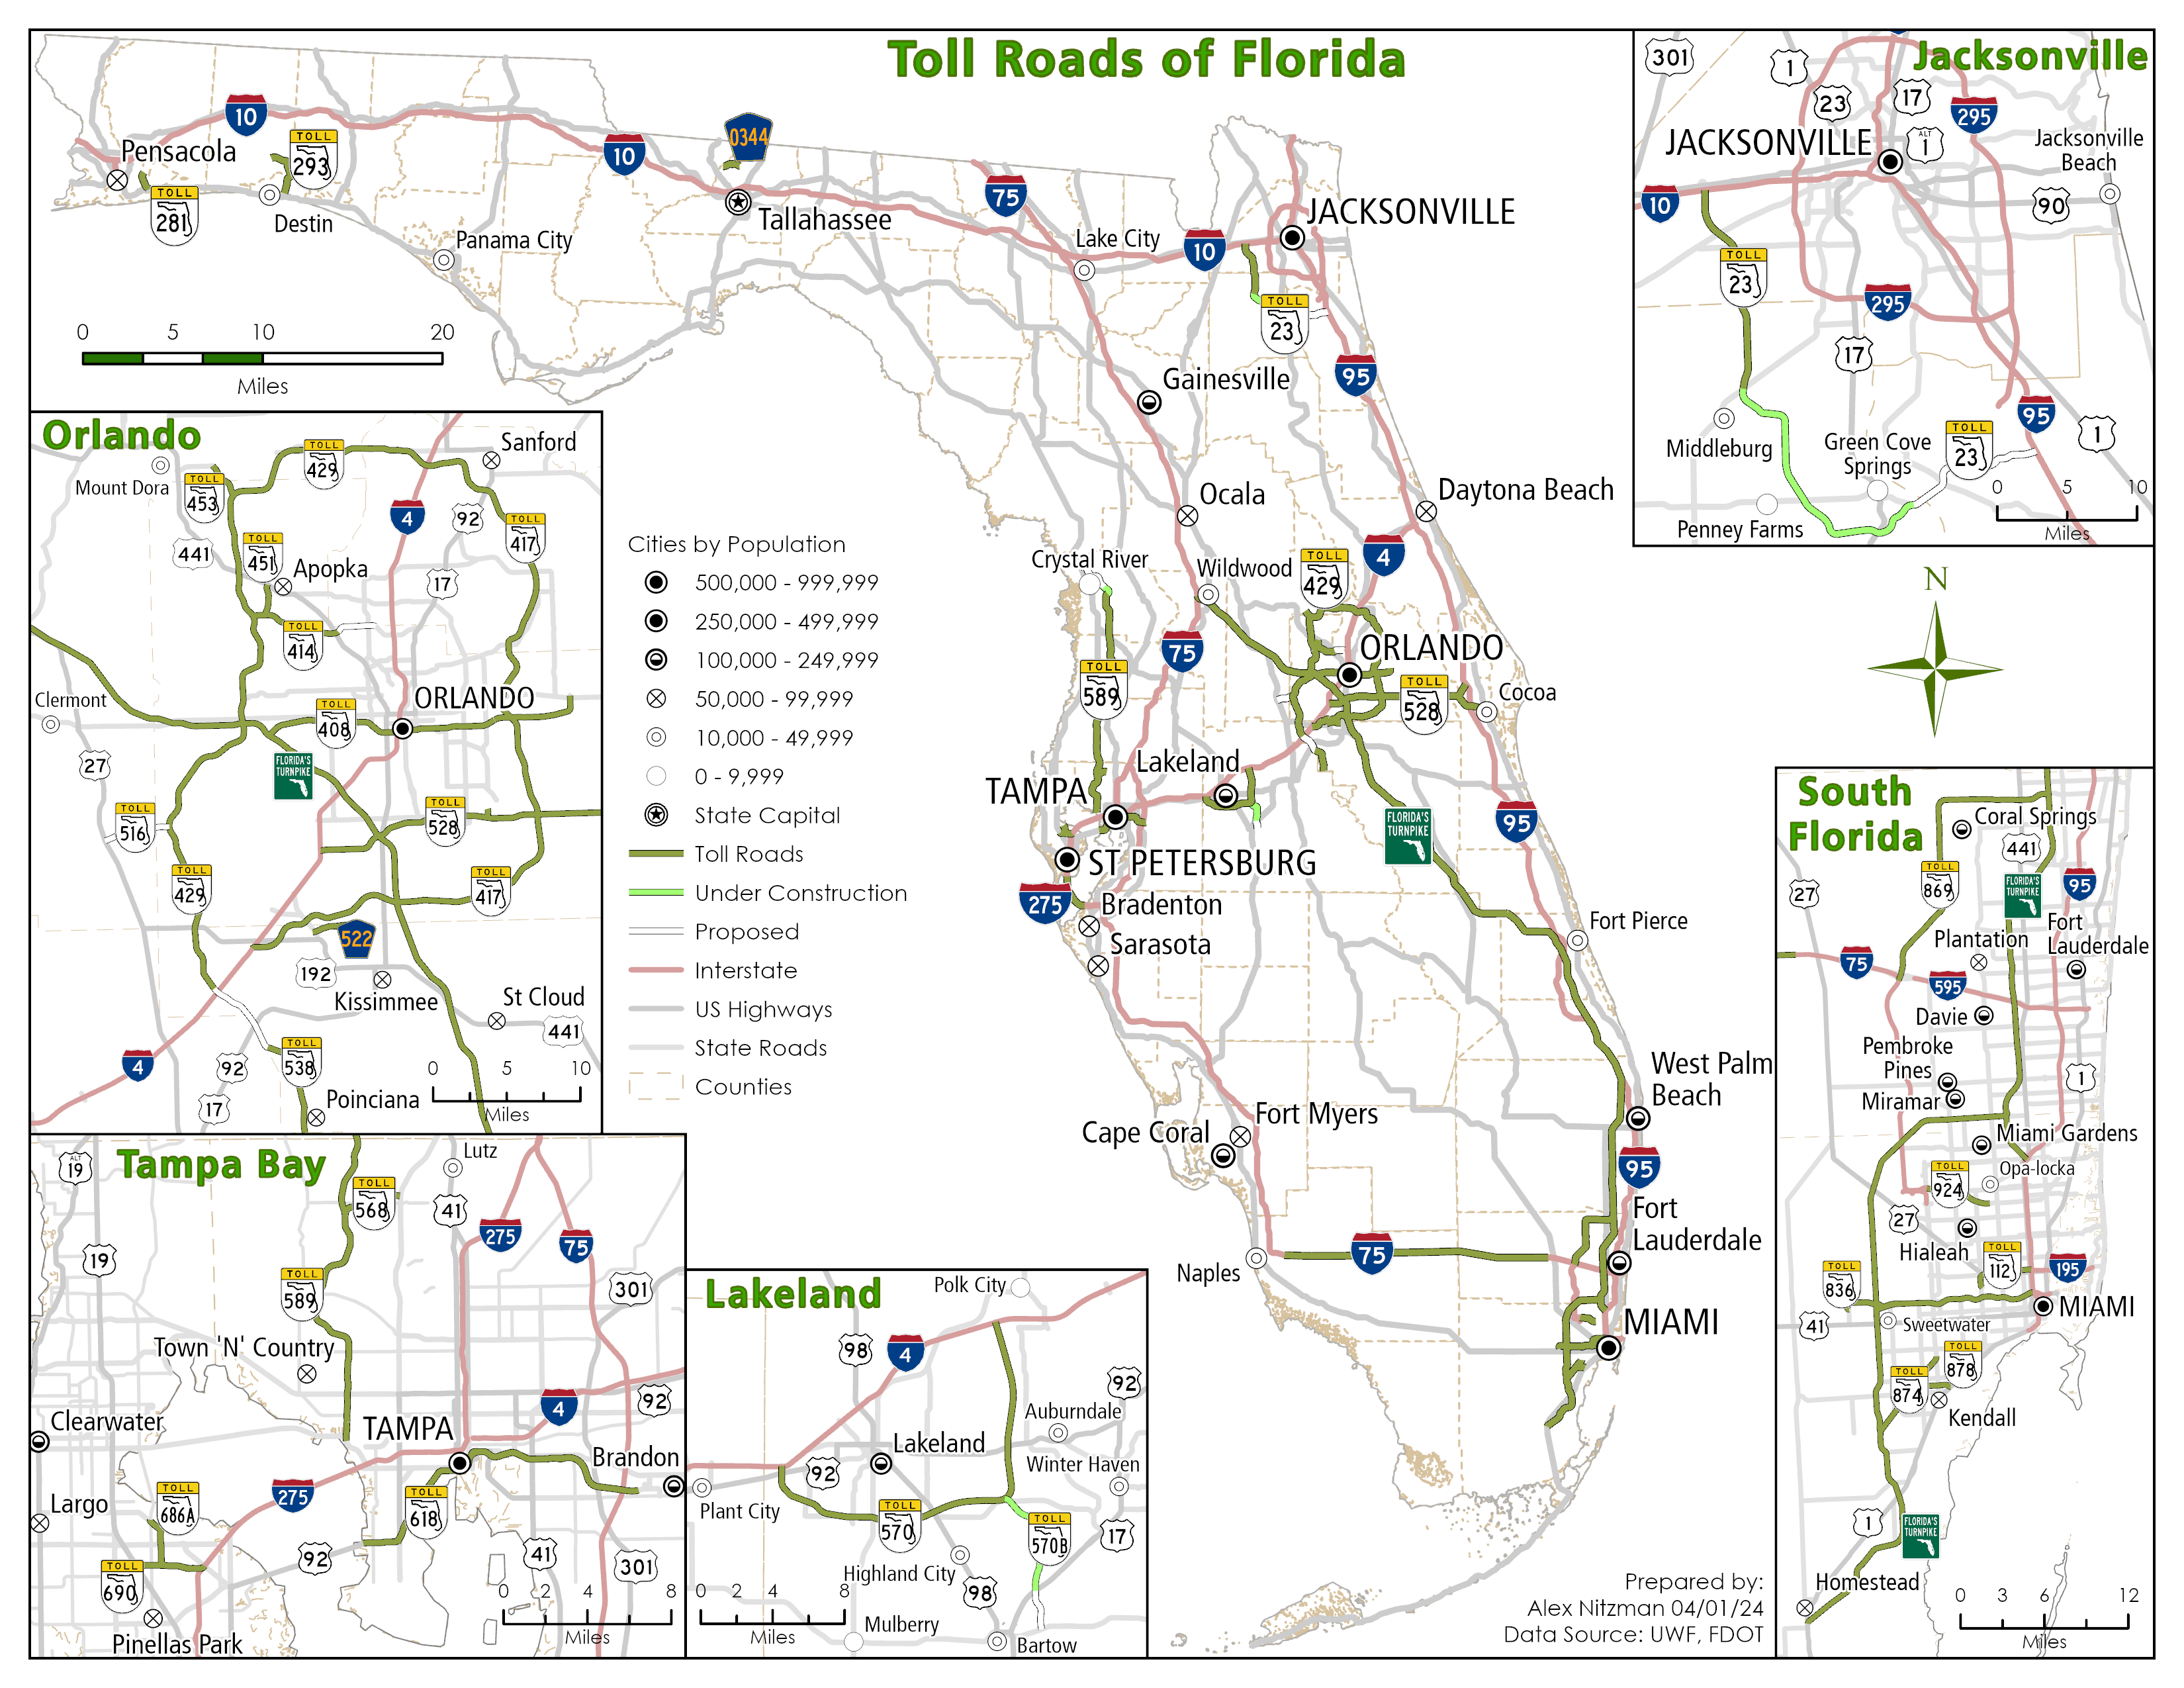
The fifth module for Remote Sensing and Photo Interpretation introduced Supervised and Unsupervised Digital Image Classification techniques. These are automated processes for converting a spectral class, a group or cluster of spectrally similar pixels, into an information class, i.e. land use/land cover class of interest.
Using multi-spectral data and spectral pattern recognition techniques, the algorithm may take many spectral classes to describe a single information class. Similarly one spectral class may represent more than one information class.
Unsupervised classification uses a form of clustering algorithm to determine what land cover type each pixel most matches. The tendency of spectral data is that pixels of one land cover class tend to cluster together. Within the Lab using ERDAS Imagine, I inputted a high resolution aerial photograph of the UWF campus and used Unsupervised Classification processing with the number of classes set to 50. Maximum Iterations and Convergence Threshold were set to prevent the program from running an infinite loop, and with a threshold resulting in a 95% level of confidence for the classification of pixels.
Eventually through reclassification, the 50 classes generated from ERDAS were pared down to just five. Using visual interpretation techniques, pixels were identified and assigned into classes for trees, grass, buildings/road, shadows and a mixed classification group. The mixed classification included pixels associated with more than one type of land use/land cover.
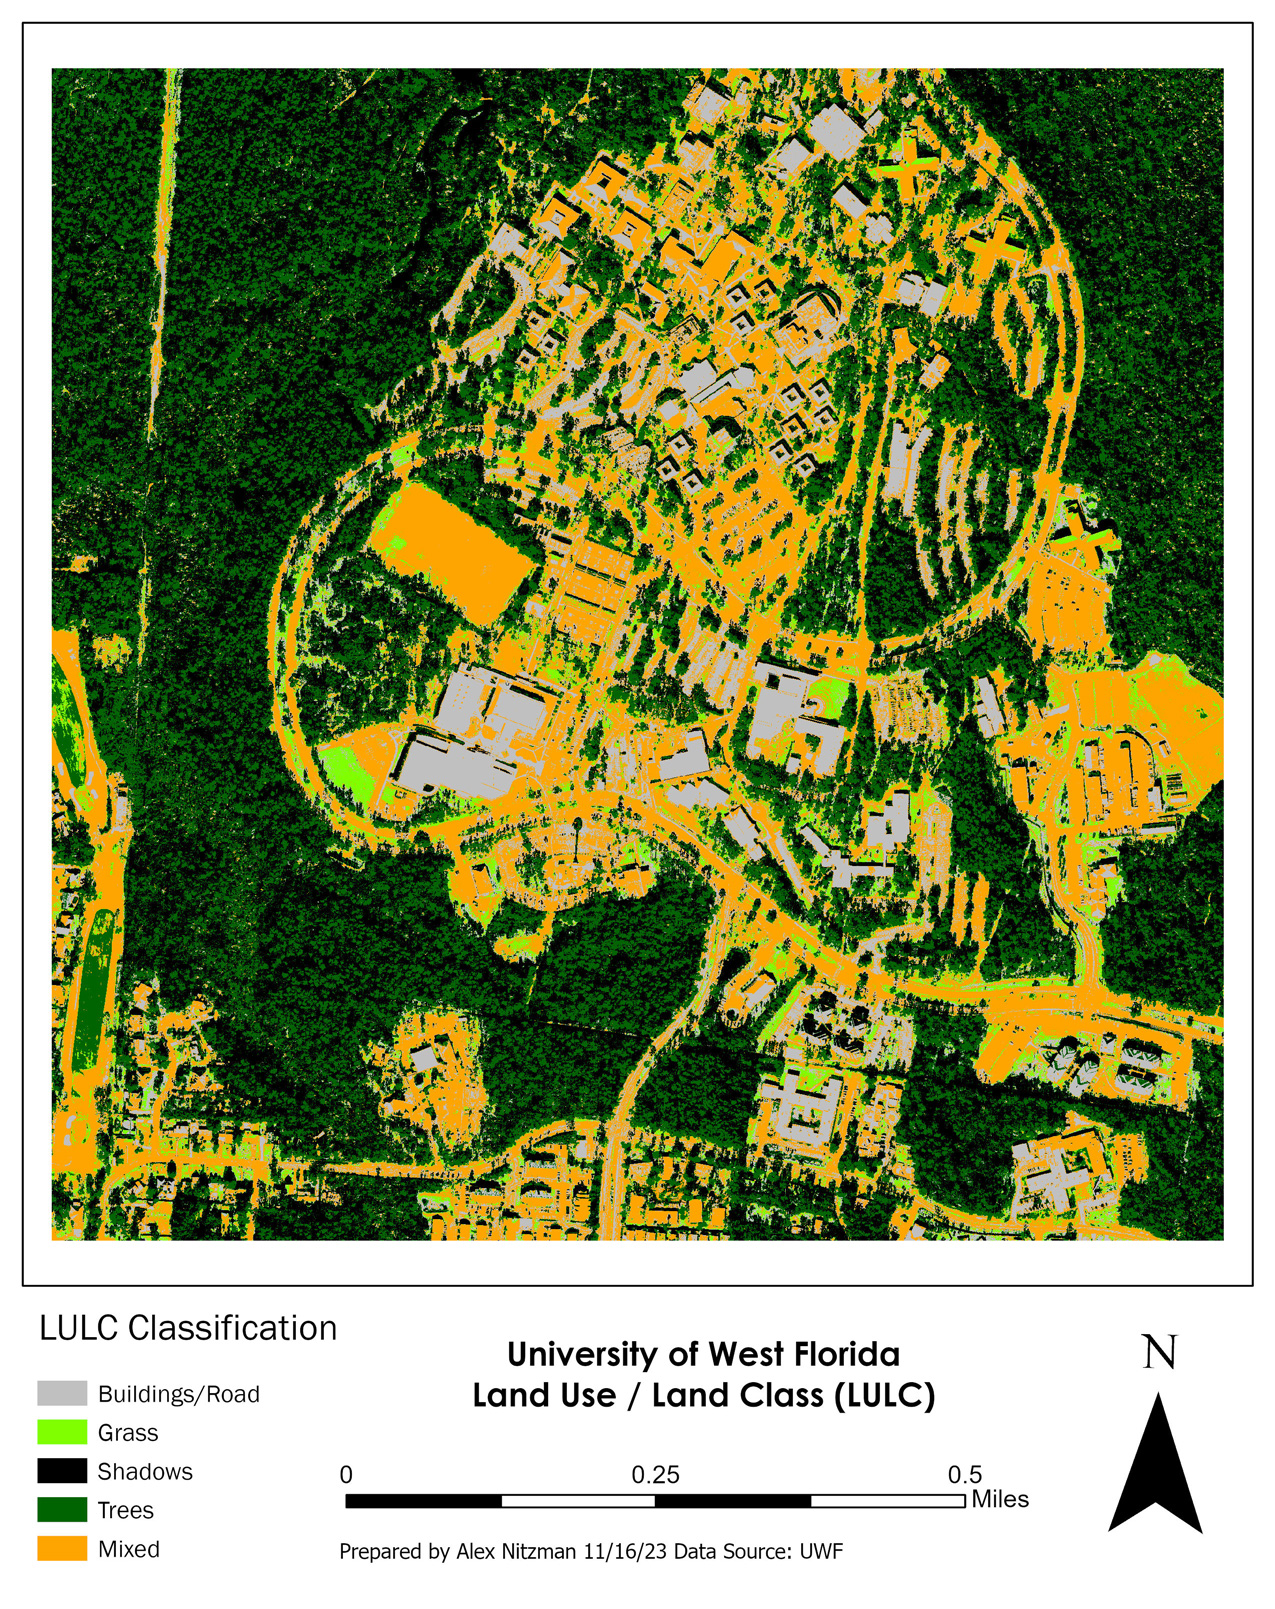
The final output after reclassifying the 50 spectral classes into five
Supervised image classification uses one of two approaches. The first is Signature Collection, where an analyst uses prior knowledge and visual techniques to identify different types of LULC to establish training sites. The second grows a polygon from a Seed pixel, where an algorithm develops training sites which tries to decrease n-class variability (N being the variable number of bands) such as by setting variance, total number of pixels and values of adjacent pixels. This is similar to the Magic Wand tool in Photoshop, which selects similar pixels across a selected area.
The supplied imagery was from Landsat TM4 of Germantown, Maryland with a low spatial resolution. The image was likely from the late 1980s or between 1990 and 1992 based upon visible construction to the south expanding Interstate 270 to four roadways.
The lab instructions provided LULC classifications for 12 preselected sites based upon their coordinates. As an analyst, I was tasked to create an AOI (Area of Interest) polygon representative of all pixels falling within the LULC specified. This proved to be quite tedious, as the spectral class of several pixels represented multiple information classes.
The AOI polygons were used to create a Spectral Signature file that ERDAS Imagine applies to an automated process for classifying all pixels within the imagery. AOI areas included urban/residential, grasses, two forest types, fallow fields and agricultural areas. Upon completion of populating the signature file, the imagery was reclassified using the Parametric Distance Approach and Maximum Likelihood classification method.
The first attempt resulted in over 10,000 acres of the imagery classified as urban/residential. Comparing the imagery with aerial photography of Germantown, MD from 1993 on Google Earth, this was clearly over exaggerated. The recoding process resulted in many agricultural tracts being misclassified as urban.
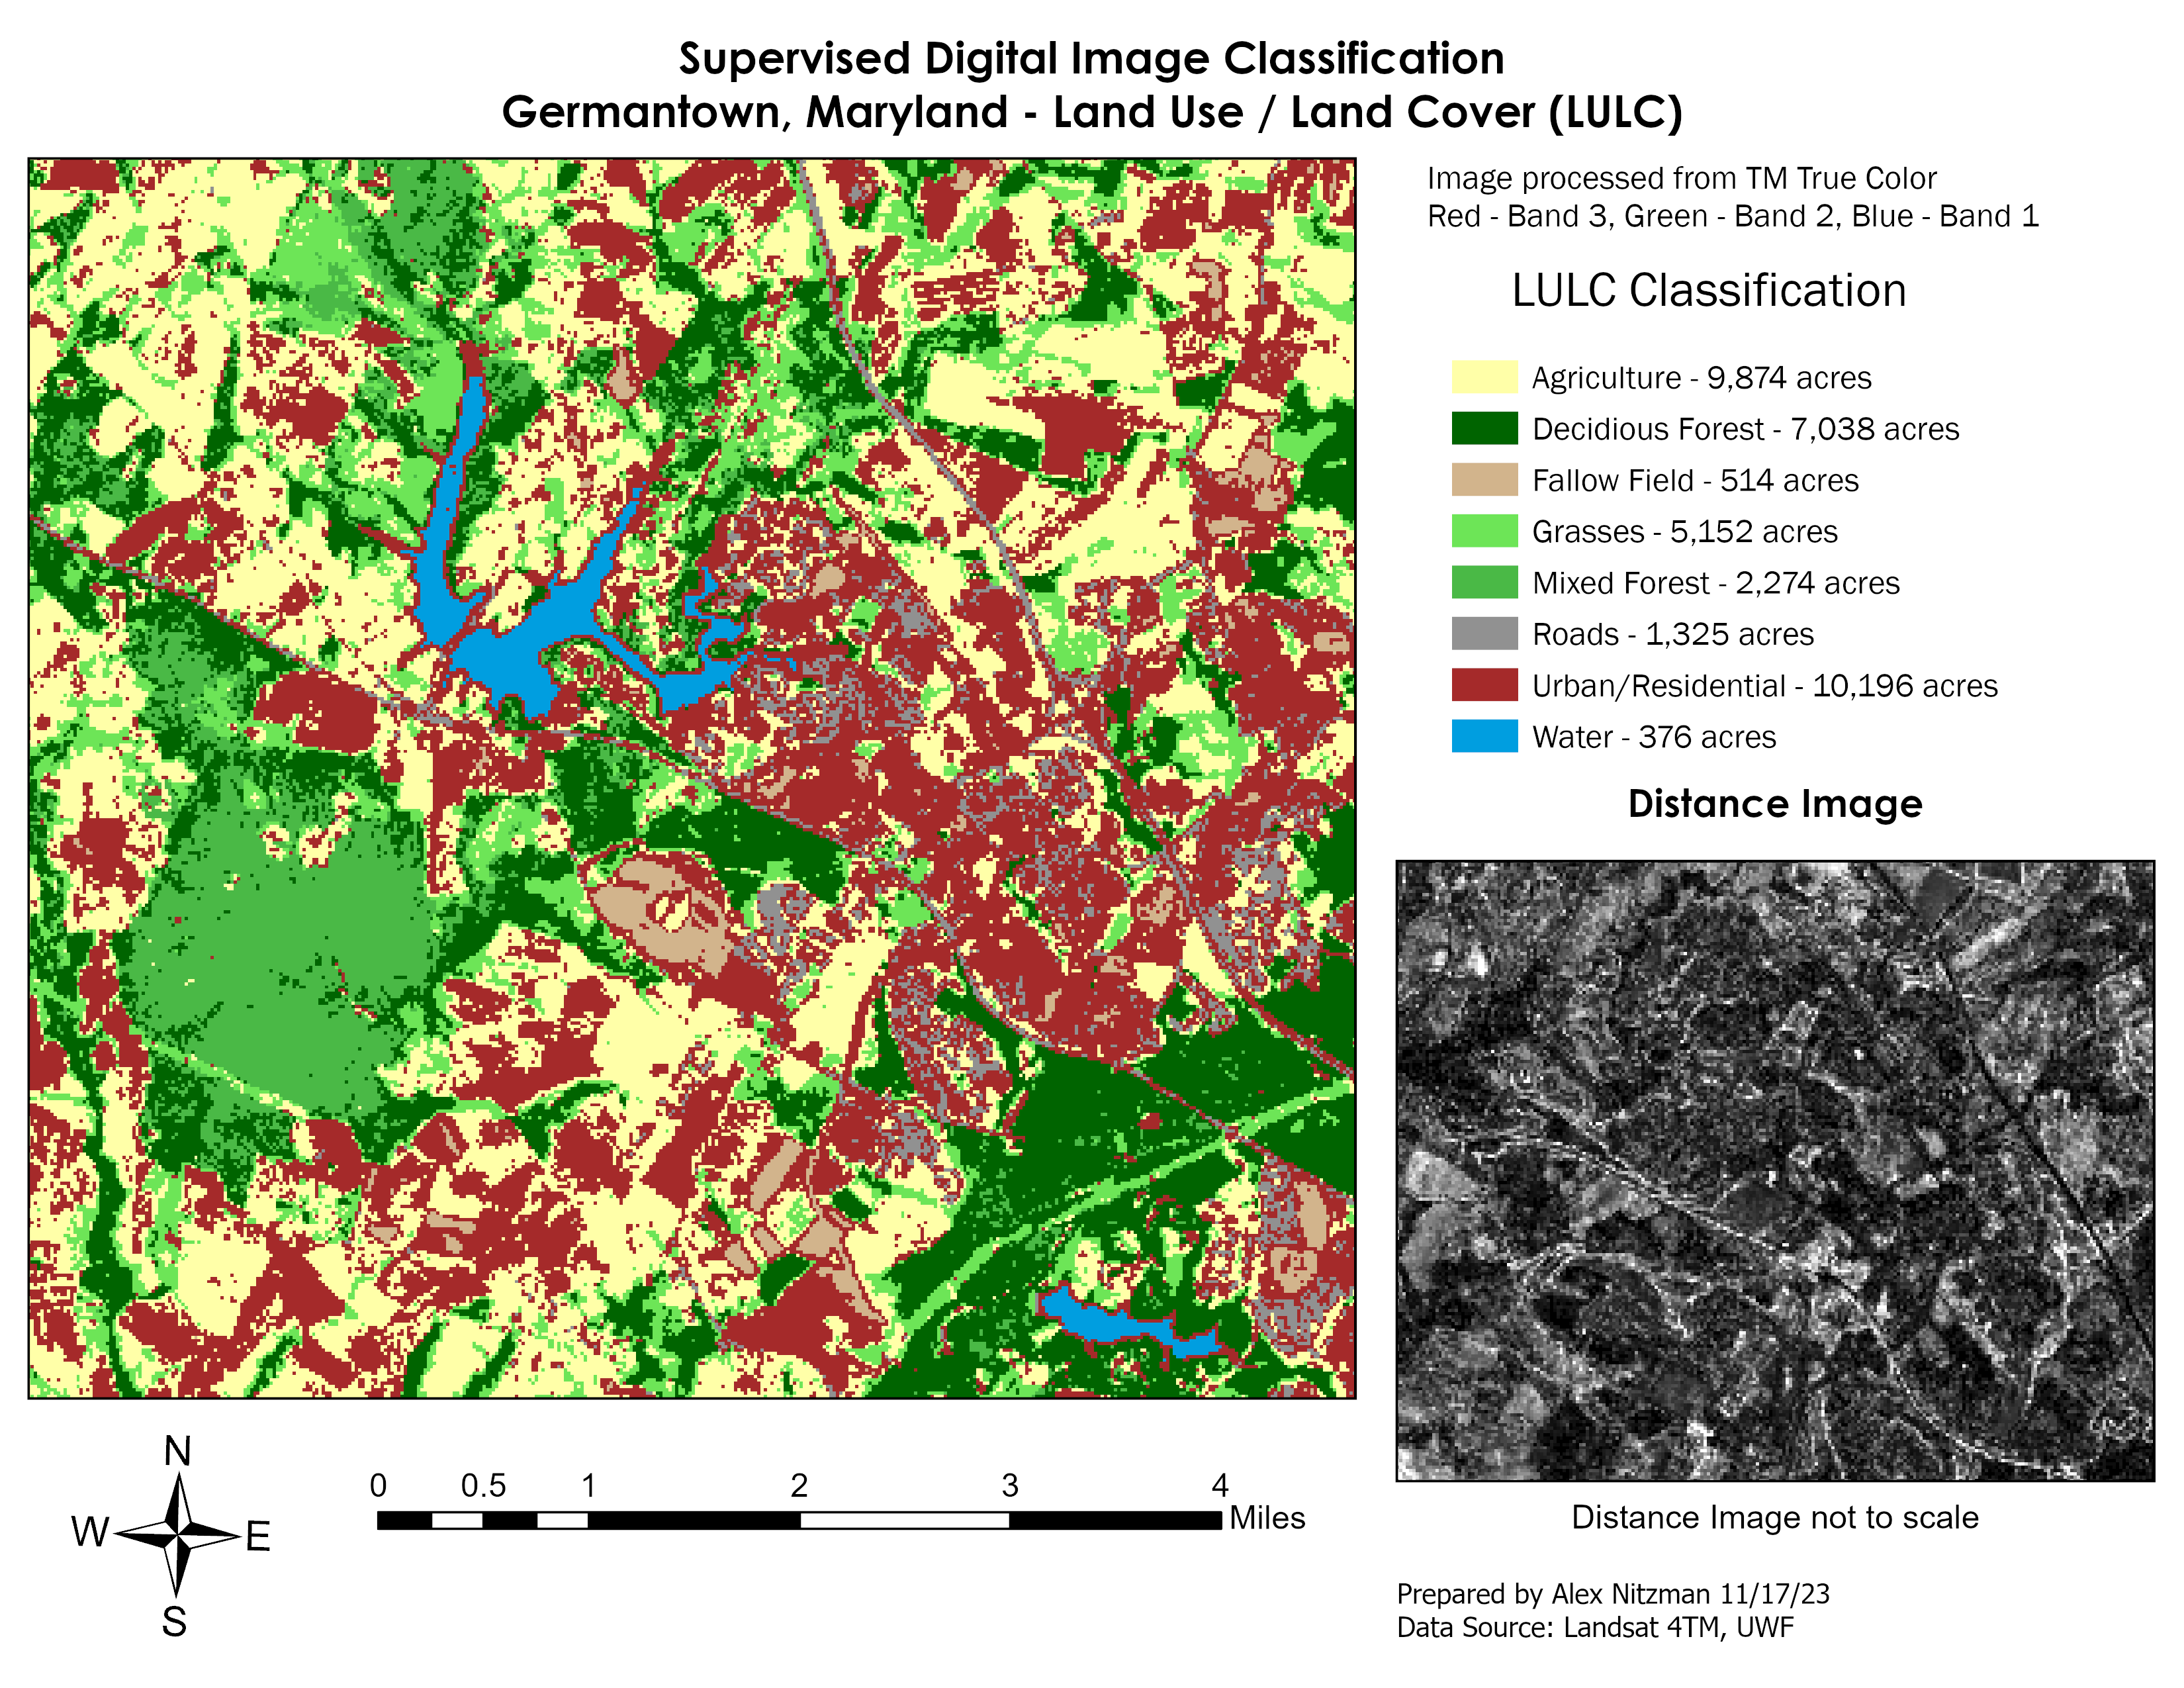
First attempt at supervised image classification for Germantown, MD LULC
Opting to start over on the AOI creation, I narrowed down my pixel areas for most of the preselected training sites. Recoding it resulted in large areas of fallow fields in place of agriculture. Returning to the signature file created, I added several new training sites based upon the distance image and visual interpretation. These mostly focused on better identifying agricultural areas.
The result was a more accurate classification of the imagery when it came to both urban/residential and agriculture. While there were still areas of farm land misclassified as urban, the percentage was vastly lower than my previous attempts.
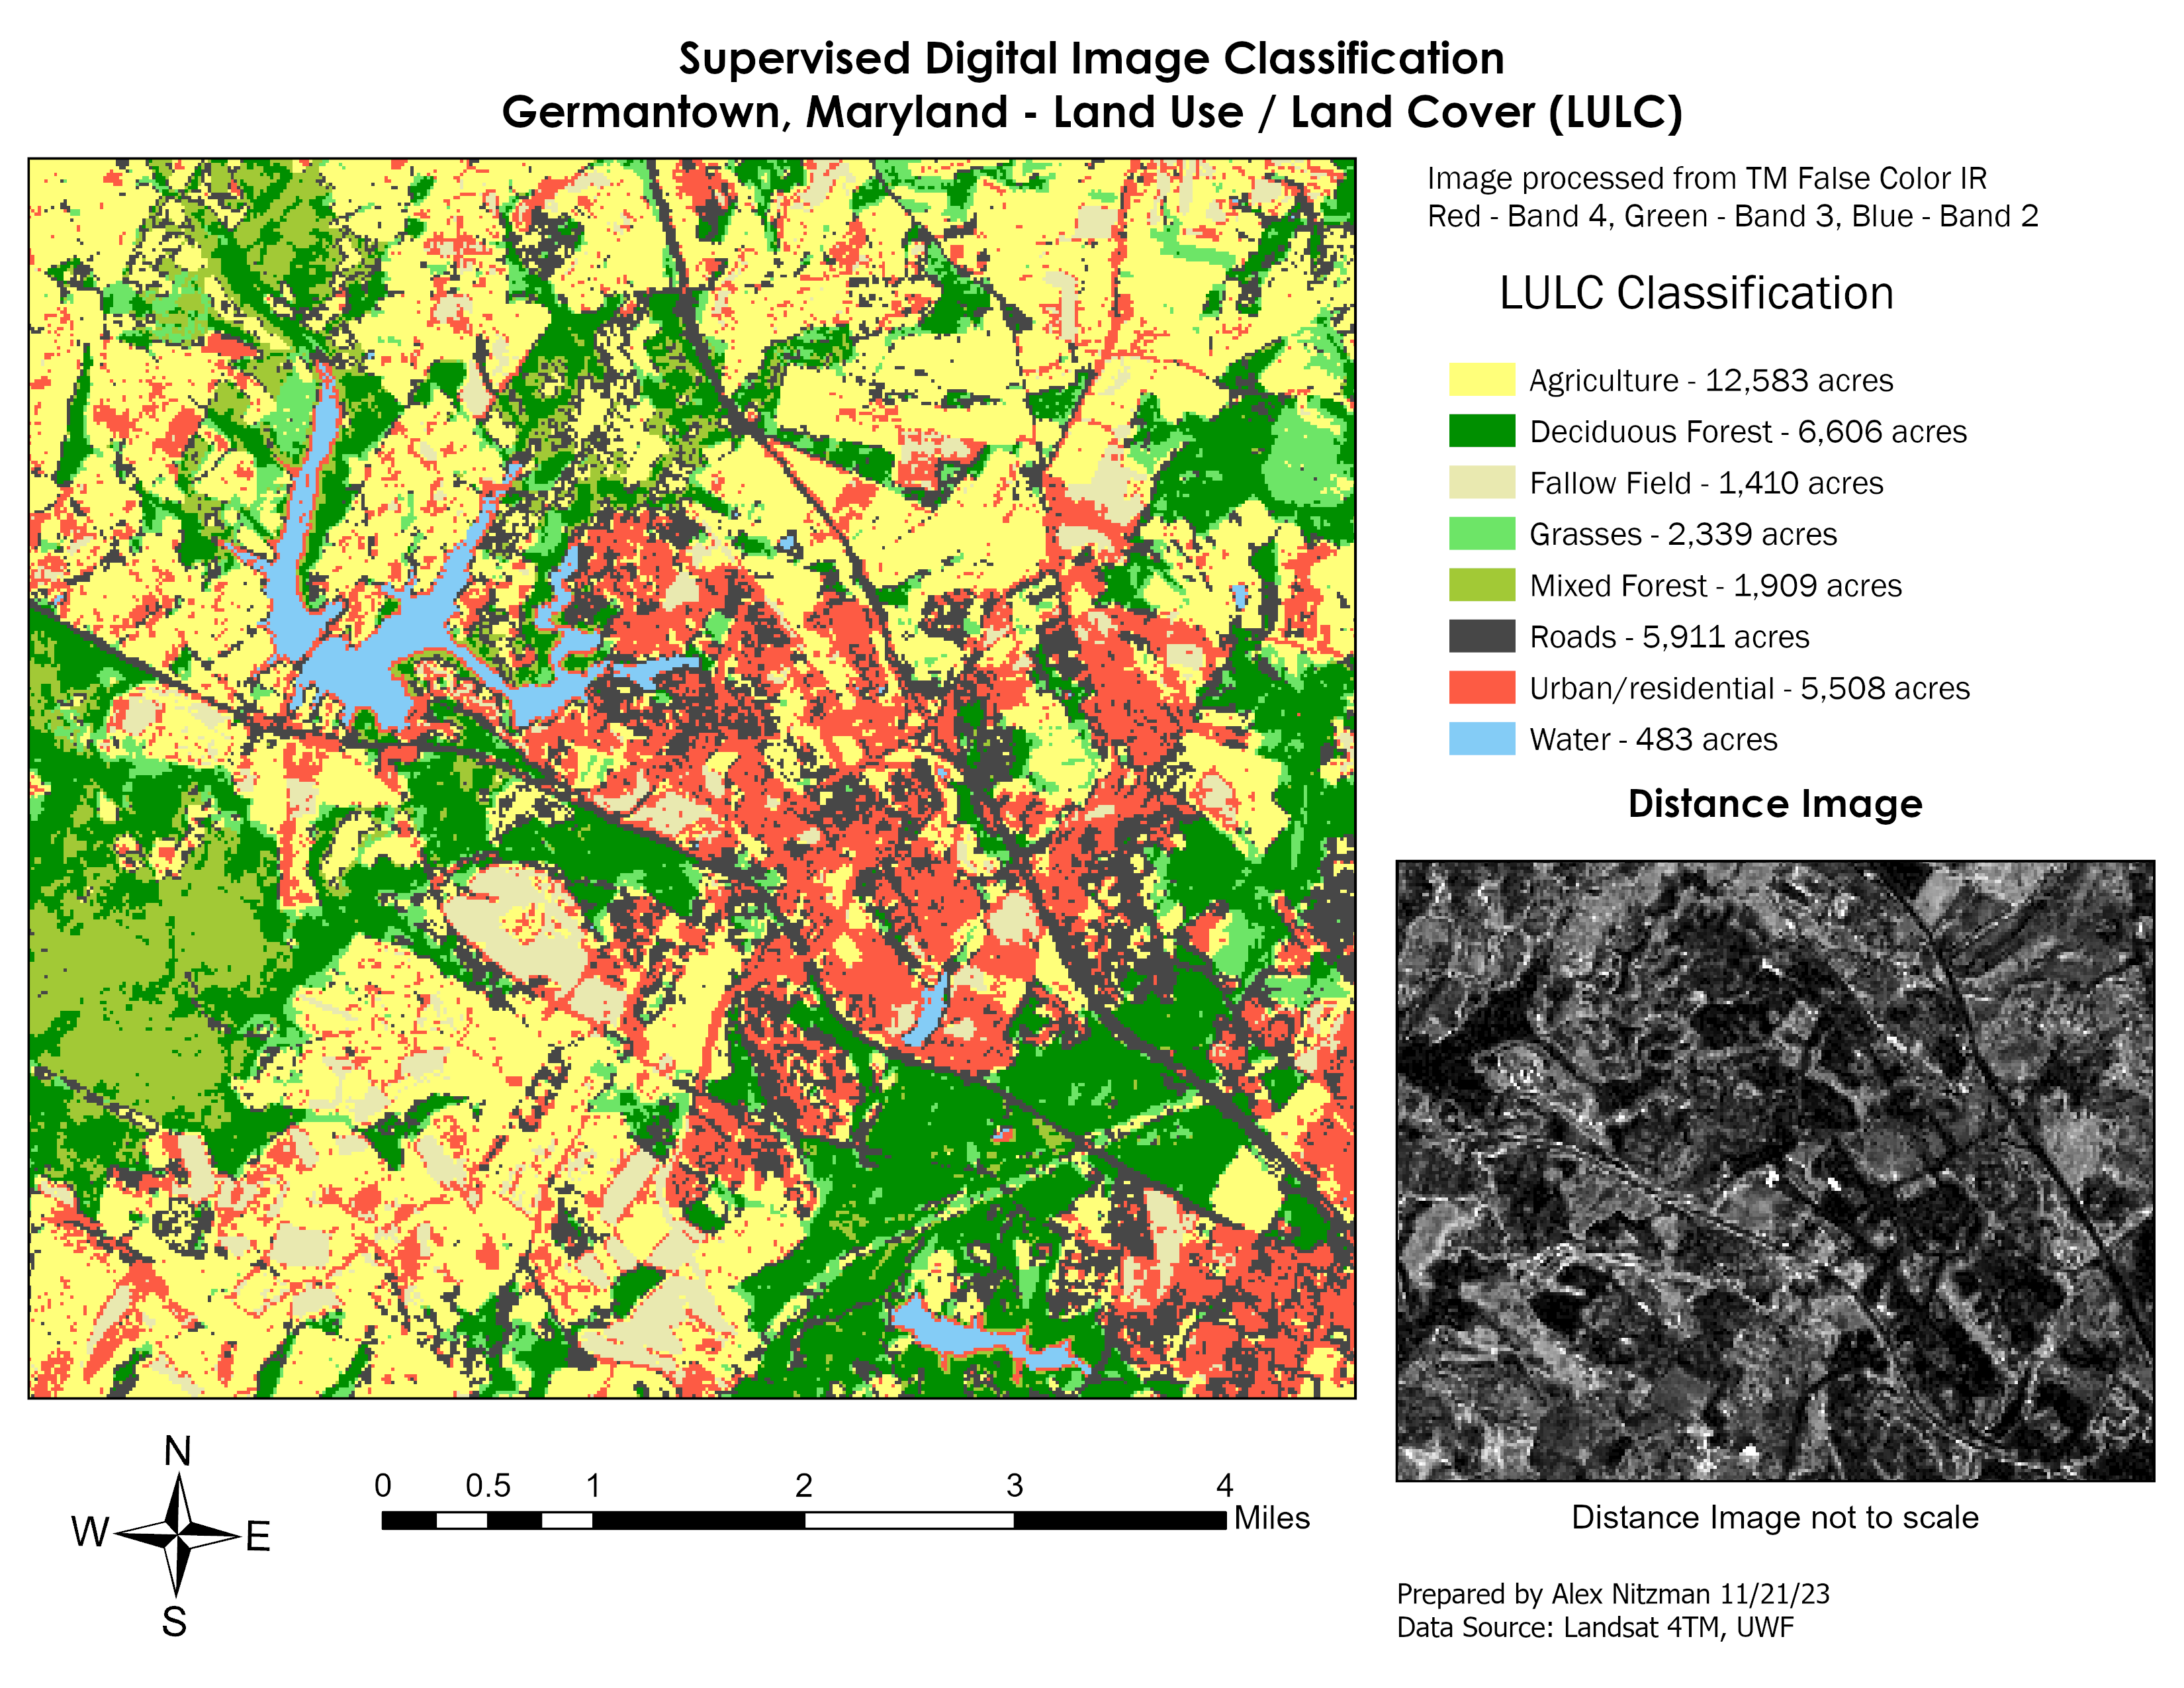
Final output of Germantown, MD LULC using Supervised Image Classification
