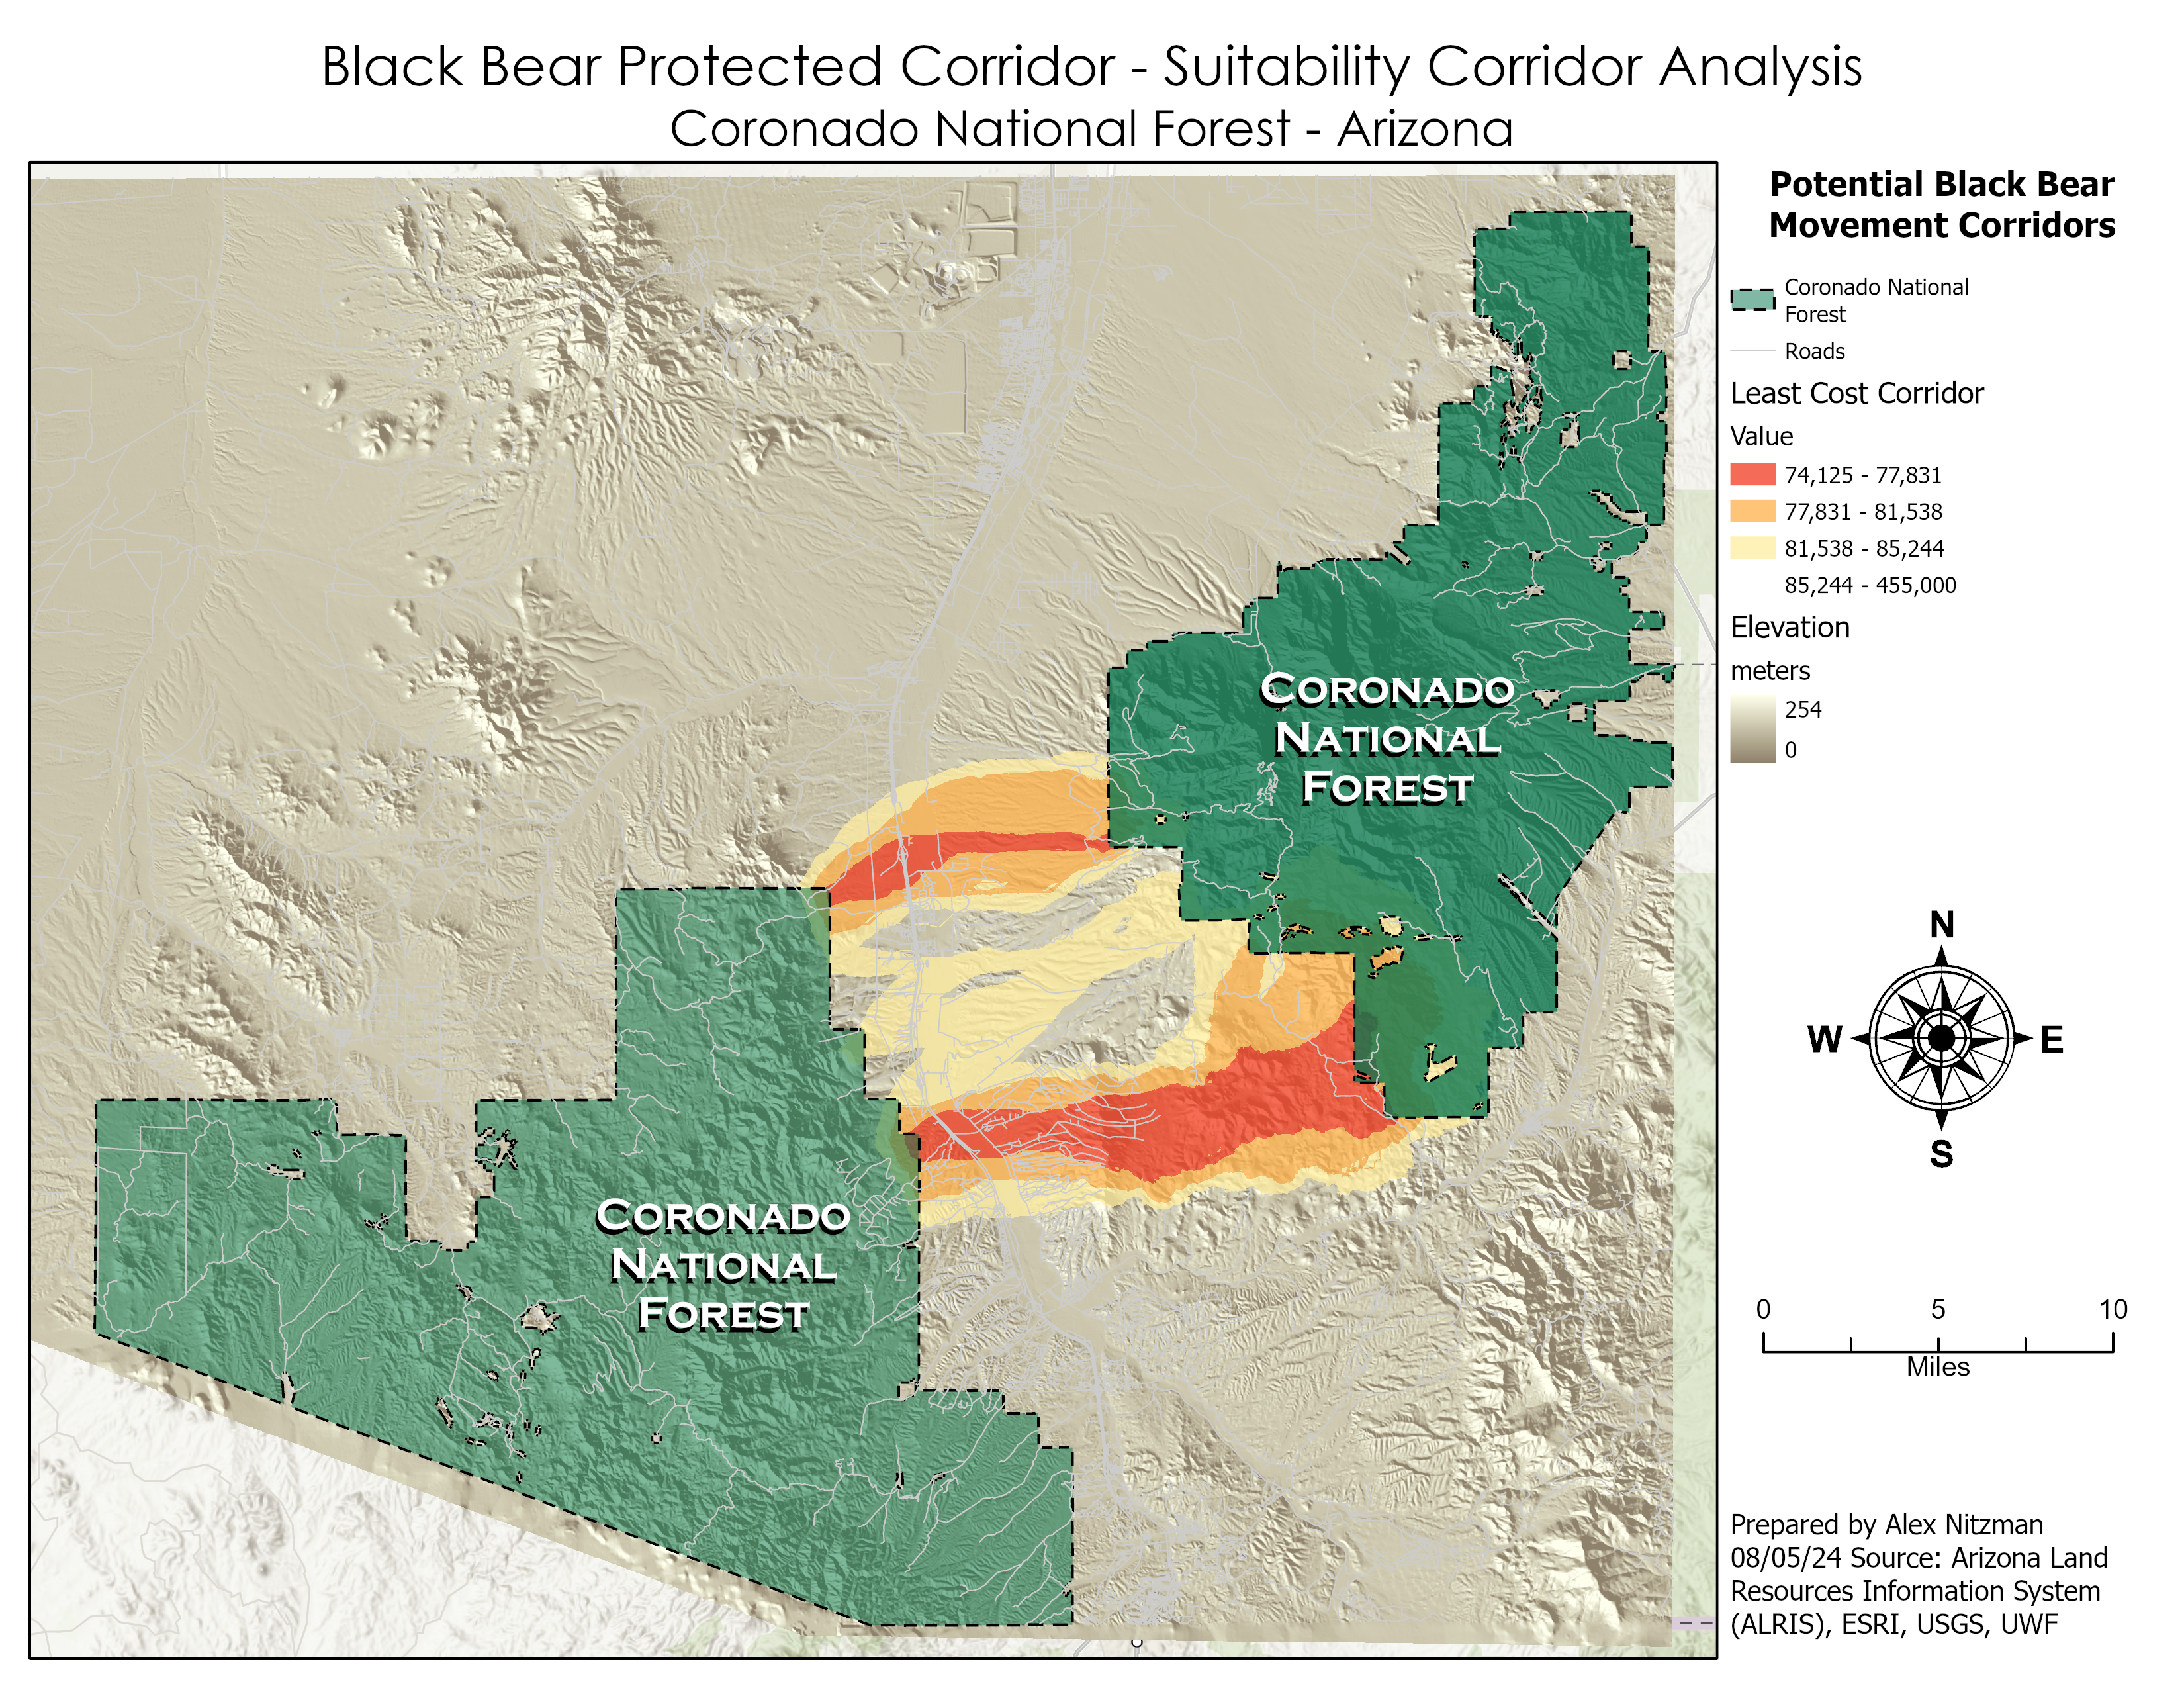
On The Road Blog

Home » Blog

Spatial Data Quality – Precision and Accuracy Metrics

The first module of Special Topics in GIScience covers aspects of spatial data quality. Furthermore, the associated lab defines and contrasts the concepts of accuracy and precision in spatial data. Quality generally represents a lack of error, where error in spatial data is the difference between a true value and an observed or predicted value. Rather than unrealistically attempting to know the exact error, an estimated error based upon sampling or another statistical [...]

By |2024-11-11T12:52:07-05:00August 24th, 2024|GIS|Comments Off on Spatial Data Quality – Precision and Accuracy Metrics

Corridor Suitability Analysis – Coronado National Forest

The final scenario for the lab of GIS Applications Module 6 is to determine a potential protected corridor linking two areas of black bear habitat in Arizona's Coronado National Forest. Data provided included the extent of the two existing areas of known black bear habitat, a DEM, a raster of land cover and a feature class of roads in the study area. Parameters required for a protected corridor facilitating [...]

By |2024-11-11T12:46:46-05:00August 5th, 2024|GIS|Comments Off on Corridor Suitability Analysis – Coronado National Forest

Least-Cost Path and Corridor Analysis with GIS

The second half of Module 6 for GIS Applications conducts Least-Cost Path and Corridor Analysis on two scenarios. The first continues working with the Jackson County, Oregon datasets from Scenario 2. There are several ways that GIS measures distance. Euclidean, the simplest, represents travel across a straight line or "as the crow flies". Manhattan distance simulates navigating along a city street grid, where travel is restricted to either north-south [...]

By |2024-11-11T12:35:32-05:00August 4th, 2024|GIS|Comments Off on Least-Cost Path and Corridor Analysis with GIS

Suitability Modeling with GIS

Module 6 for GIS Applications includes four scenarios conducting Suitability and Least-Cost Path and Corridor analysis. Suitability Modeling identifies the most suitable locations based upon a set of criteria. Corridor analysis compiles an array of all the least-cost paths solutions from a single source to all cells within a study area. For a given scenario, suitability modeling commences with identifying criteria that defines the most suitable locations. Parameters specifying [...]

By |2024-11-11T12:20:12-05:00August 1st, 2024|GIS|Comments Off on Suitability Modeling with GIS

Damage Assessment – Hurricane Sandy

Module 5 for GIS Applications continues our focus on Hurricane Sandy and explores damage assessment for the storm's impact in the Garden State. Our first task was to create a formal hurricane track map showing the path Sandy took from the Caribbean Sea to the Northeastern U.S. The symbology uses custom color coded coordinate points showing the hierarchy of storm intensity. Included are the maximum sustained winds and the [...]

By |2024-11-11T12:14:37-05:00July 30th, 2024|GIS|Comments Off on Damage Assessment – Hurricane Sandy

Coastal Flooding Analysis – Storm Surge

Module 4 for GIS Applications performs analyses on coastal flooding and storm surge. Storm surge is generally associated with landfalling tropical storms and hurricanes, but it can also be attributed to extratropical storms, such a Nor'easters along the Eastern Seaboard, or powerful winter storms with low barometric pressure and tight wind gradients. Coastal flooding events can also be due to spring tide events based upon the moon's cycle. The [...]

By |2024-11-11T12:03:51-05:00July 24th, 2024|GIS|Comments Off on Coastal Flooding Analysis – Storm Surge

Visualizing data in 3D with GIS

The course work for GIS Applications Module 3 looks further into 3D visualization, Line of Sight (LOS) analysis and Viewshed analysis with ArcGIS Pro. We are tasked with completing four exercises through ESRI training and read an article accessing the Lines of Torres Vedra, the defensive lines constructed to defend the Portuguese capital of Lisbon against Napoleon in 1810, with LOS analysis in GIS. Presentation of GIS data in [...]

By |2024-11-11T11:45:34-05:00July 17th, 2024|GIS|Comments Off on Visualizing data in 3D with GIS

GIS applications using LiDAR

Module 2 for GIS Applications returns us to take a more in depth look at the use of LiDAR, a topic briefly covered in previous courses. LiDAR (LIght Detection And Ranging) uses lasers, usually in the visible or near-infrared portion of the spectrum, calculates heights by measuring distances between a scanner and target area. The high energy pulses record the reflected response of different objects in a very narrow [...]

By |2024-11-11T10:55:56-05:00July 8th, 2024|GIS|Comments Off on GIS applications using LiDAR

Crime Analysis in GIS

Our first topic in GIS Applications is crime analysis and the use of crime mapping for determining crime hotspots. Crime mapping techniques provide insight into the spatial and temporal distributions of crime. This benefits criminologists in the research community and professionals in law enforcement. Crime mapping factors in the importance of local geography as a reason for crime and considers that it may be as important as criminal motivation. [...]

By |2024-11-11T10:45:59-05:00July 3rd, 2024|GIS|Comments Off on Crime Analysis in GIS

Working with Geometries in Python

Module 6 introduces both working with geometries with Python and external text files or tabular data. Using geometry objects in memory can be used for input and output in geoprocessing. This also circumvents the need to make temporary feature classes. Utilizing the open() function, fileinput module, and write module, text from .txt, .csv and other files can be imported into Python or exported to a file outside of ArcGIS Pro. The readlines() and writelines() methods also work with external [...]

By |2024-11-11T10:21:00-05:00June 21st, 2024|GIS|Comments Off on Working with Geometries in Python
Go to Top